A Brief Overview of Measure Objects
A universe has three basic types of result objects: dimensions, details, and measures. Measure objects are analytical values like dollars or quantities. Measure objects have two extra settings that dimensions and details do not have: a SQL aggregate function and a report Projection function. The SQL aggregate function is not enforced by the application, but it should always be present. (That’s a subject for another blog post. Or two.)The SQL aggregate function is performed by the database server, and the projection function is used by the report engine. This is what makes measures “roll up” when you slice and dice or drill on a report. The problem is, certain calculations cannot be done by the database because there is no valid projection function. Designer 3.x gives me a way to address that by introducing a new projection function setting of Database delegated. This post will explain why that’s important and how it works
Mainly
It is recommended for ratio's and averages to set the projected aggregation
to database delegated.or the calculation which Is having division since the
BO not calculate properly these type of functions so we have to use database delegated measure,When the
option of database delegated is selected as the projected aggregation,it
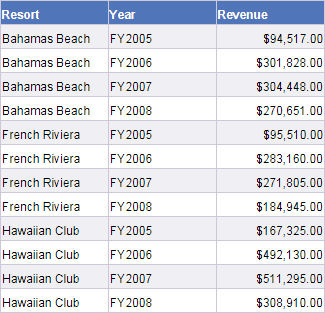
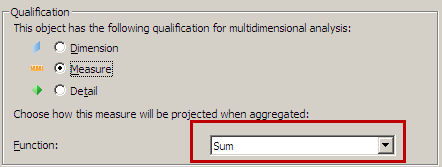
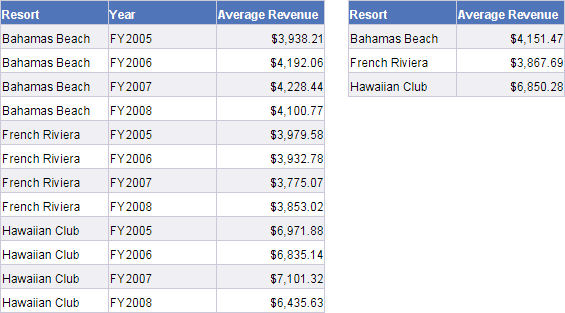
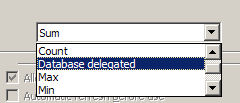
pushes the calculation of these objects to the database server.How Projection WorksThe projection function is designed to complement the SQL aggregation operation. For example the Revenue object from Island Resorts has the following SQL formula:sum(INVOICE_LINE.DAYS * INVOICE_LINE.NB_GUESTS * SERVICE.PRICE)The object also has a Sum projection function. If I run a query that returns the Resort and the Year and the Revenue the output looks like this:  Using a simple drag-and-drop technique I can remove the Year from the output block and the projection function causes the data to roll up to this result:  This is all controlled via the projection function which is a part of the object properties screen as shown here:  When Projection FailsThis all works very well until a special function like Average is considered. Averages cannot easily be projected because the source data could be very skewed. A sum operation can be applied recursively. What this means is that 1 + 5 generates the same result as 1 + (2 + 3). An average is not recursive. An average of 1 and 2.5 is not the same as an average of 1, 2, and 3. For the record, and average of 1 and 2.5 is 1.75, and an average of 1, 2, and 3 is 2. Even with a very small set of data the results of an average projection can be very wrong.The basic problem here is that averages have to work with the source data. I cannot apply an average to an average and expect to get the correct result. It is for this reason that report developers have had to create average and percentage calculations on their reports rather than reusing an object from a universe. In order to deliver the correct result I have to work with the source data. Averages Do Not Average WellAs I said in the prior paragraph, the only way to generate the correct result for an average is to recalculate it from the source data. In order to demonstrate this I have created an Average Revenue object in my universe. For this screen shot I have used the average object in two different queries. The first shows Average Revenue by Resort and Year, and the second shows Average Revenue by Resort only. The object is created with the following SQL: avg(INVOICE_LINE.DAYS * INVOICE_LINE.NB_GUESTS * SERVICE.PRICE)… and the projection function is set to Average. As I did before I can apply a simple drag-and-drop operation to remove the Year object from the first block, allowing the report engine to project the Average Revenue using the selected projection function of Average. Are the results correct?  The results are wrong because the projection in the first block is taking three years of data, summing them up, and then dividing the total by three to get the new average value. The true result based on a database calculation is shown in the right block. The second block was not affected by the Year values since the query did not include that object in the result set. Delegated MeasuresThis is where the delegation process comes in. As a universe designer I can now create an object that will project correctly (yay) at the expense of having to run a database query (boo). Instead of projecting my average calculation using the Average function, I will use the Database Delegated option instead. Here’s how that looks: When I run the same query with my new measure definition here is what the initial output looks like:  The difference becomes apparent when I drag-and-drop the Year object away from my block:  The note #TOREFRESH is telling me that before I can see the numbers for that column I have to refresh my document. I think that it’s nice that it doesn’t refresh right away, as it gives me the opportunity to make more adjustments. Perhaps on a more complex report I want to remove (or add) more than one object from the block. In any case, when I click the refresh button the results are displayed.  Note that the two blocks are 100% the same now. The option to delegate the average calculation to the database has given me the power to create an entirely new type of object that I could not have done before. ConclusionThis is another nice new feature for Designer. It will provide me with better control over how my measure objects are handled. In this case, the solution is not without a cost… I may have to refresh the report in order to force the data to be updated. If the query takes a long time to run, there is a cost involved. It may ultimately still be easier to do this type of calculation on the report.Here is another challenge that is not solved by this technique: I can’t do calculations that cross contexts in the universe. Suppose that I have one context for current year measures, and a second context for prior year measures. If I want to compare current to prior year values, that has to be done on the report. Delegating that calculation to the database is not possible because the values come from two different contexts |
No comments:
Post a Comment